

I know! Your test computer does not have a serial port and you need to do Kernel debugging on it. I believe that, after the serial port, the most widely used way to debug the Windows Kernel is by using a firewire interface. There is still the option of doing Kernel debugging over USB 2.0, but that is still for the few, since besides only being supported on Windows Vista, you also need a special cable. The details about Kernel debugging over the USB port can be found in this post. Today the story is a different one.
But I do not have a firewire port
Stop being such a crybaby. What matters here is not whether or not you have a firewire port on your development machine, but rather the fact that the client’s machine has a firewire port. You know very well that, by Murphy’s Law, that problem you did not even know existed only ever happens on the machine that has no serial ports. So you had better be prepared to run into this kind of thing. It really does happen. Your complaint could also be a different one: “But I do not have a serial port”. Some notebooks that have no serial ports offer firewire ports, but regardless of that, there are both PCI and PCMCIA cards capable of providing the IEEE 1394 interface. This way, whether your machine is a desktop or a notebook, there are ways for them to gain firewire ports.
Configuring the TARGET side
If you still do not know what the HOST/TARGET side means and are completely lost on the subject, read this introductory post before continuing. Configuring the TARGET side is not very different from what we have already seen in other posts in this series. We can edit the boot.ini file, as we already saw in this post, to add the following debug settings.
[boot loader]
timeout=10
default=multi(0)disk(0)rdisk(0)partition(1)\WINDOWS
[operating systems]
multi(0)disk(0)<<...>>/fastdetect /debugport=1394 /channel=44
multi(0)disk(0)<<...>>/fastdetect
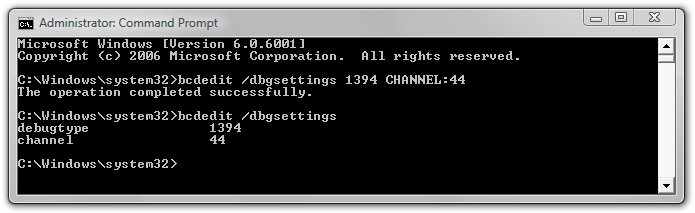
The channel number to be used can be any value, but the value must be the same on both the TARGET and HOST sides. In case you are trying to debug a Windows Vista, the method for configuring these same things changed a little, as we saw in this other post. The figure below shows the steps to set the system configuration mode for the IEEE 1394 interface.
Remember that here we are only configuring the way in which the system would be debugged in case a debug entry exists in the machine’s boot list. This post shows the details of how to create an additional entry in this list and configure it for debugging.
That is it? It did not even hurt!
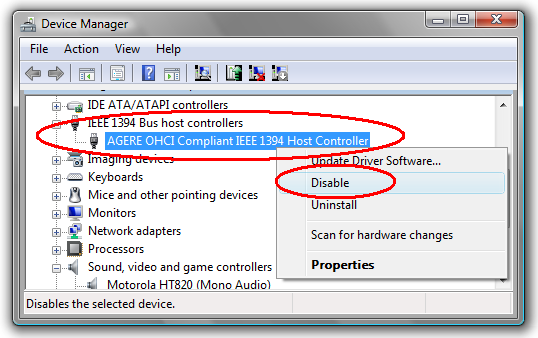
To do Kernel Debugging using a firewire cable, both machines must be running Windows XP or higher, not necessarily the same version on both sides. There is a particularity regarding the use of systems earlier than Windows XP SP2 or Windows 2003 Server without a service pack on the TARGET side of the story, as this page reports. For these systems, you must disable the 1394 bus controller. This is necessary because Windows, which is being debugged unwittingly, may try to talk to the Firewire interface during the debug, and that can cause the connection to the debugger to drop. To disable this interface on the systems mentioned above, you simply select the “Disable” item in the context menu that appears when you right-click on the firewire controller.
Can I disable the Firewire controller regardless of the Windows version? No. If you disable the controller on systems later than those mentioned above, you may not be able to debug the system when it switches between the system power states. Power states? Are you talking about the computer’s aura? Suppose you want to debug your driver during the system power transitions, which are managed by the Power Manager. The Power Manager determines which bus can be turned off to save energy. So the system may decide to turn off the firewire interface during your debugging of some driver, and that way you will not be able to follow the power-management IRPs arriving at your driver.
Configuring the HOST side
Normally, to start a debug session on the HOST side, you just open WinDbg, select the “Kernel Debug…” item from the File menu, click on the 1394 tab, fill in the channel number you want to use, click OK as shown in the figure below, and run for a hug.
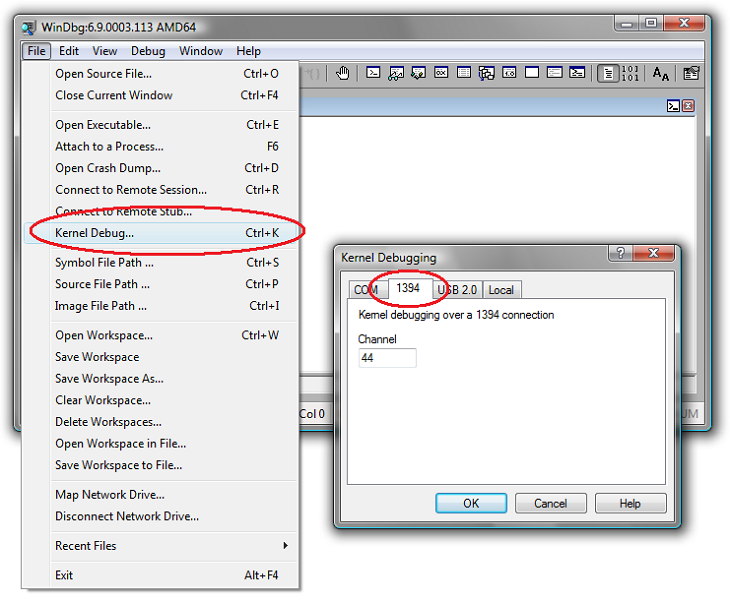
Everything I have just described still holds, but in order to be able to use firewire on the HOST side, WinDbg needs to install the virtual drivers for accessing the IEEE 1394 bus, as shown on this page. WinDbg does this automagically when you select the options above, but the drivers can only be installed if you are logged in as the system administrator. Otherwise you will receive the following message.
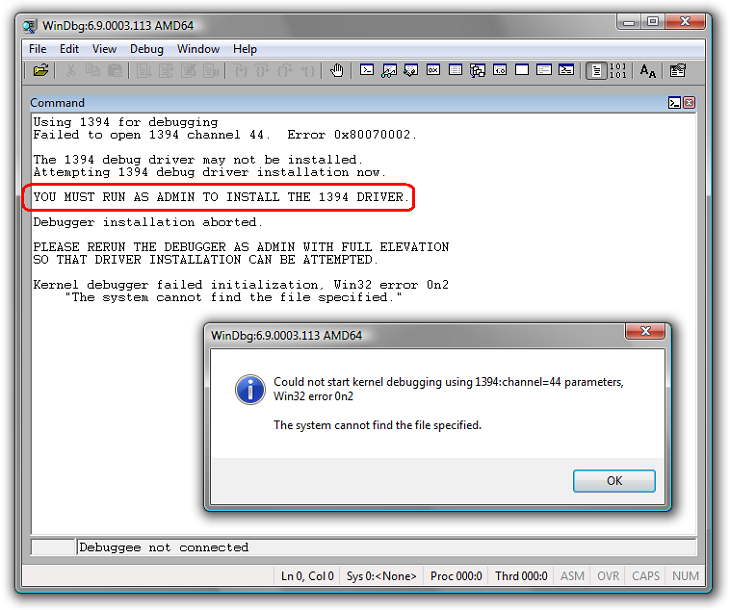
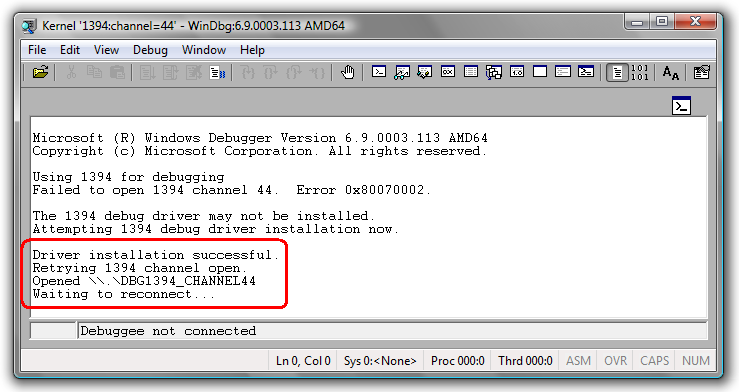
Come on, Fernando, I am a driver developer! Do you really think I am not the administrator of my own machine? All right, you may well be, but even being an administrator on Windows Vista you will need to run WinDbg by right-clicking on the WinDbg icon and selecting the “Run as Administrator” item. Then, yes, you repeat the procedure described above so that the virtual drivers get installed. This procedure is only necessary the first time you use the firewire port for debugging; the next times, the drivers will already be installed. For those using a system earlier than Vista and already using an administrative account, it is like my friend Thiago says: “It comes out in the pee”. That is, the virtual driver will be installed and you will get the output shown in the figure below, which demonstrates the same operations performed on Windows Vista running WinDbg as Administrator.
From there on, it is just debugging, really.
Dump Racing
Taking advantage of the fact that we are all gathered here, let us run a test and check whether the speed of firewire really helps when it comes to Kernel Debugging. Let us imagine the situation where you are visiting a client where, obviously, your driver is not working properly. Remember that bug you did not even know existed? Well, it turns out to be a deadlock. Deadlocks are especially dear when it is time to debug, because you are right there when the problem happens, but a nice blue screen? no such luck. In this situation, you can generate a dump file of the machine and leave the problem to be analyzed at home, after all, you wash your dirty laundry at home, and that way you can free up the client’s machine for use, since normally in these situations there are about three people breathing down your neck asking “So? Did you find the problem?” every 3 minutes. I set up my desktop here at home to debug Windows Vista over a serial port. This machine has 2GB of RAM. A full dump file is a copy of everything that is in the computer’s memory at that instant, so it is only fair that this file be approximately 2GB in size. This file can be generated on the HOST machine during a debug session using the .dump command. Below is the output of this command when used over a serial connection.
0: kd> .dump /f c:\Temp\SERIAL.DMP
Creating a full kernel dump over the COM port is a VERY VERY slow operation.
This command may take many HOURS to complete. Ctrl-C if you want to terminate the command.
Creating c:\Temp\SERIAL.DMP - Full kernel dump
Percent written 0
Percent written 1
Percent written 2
:
:
Did you notice the threatening message we were shown? Personally, I think these software engineers are all a desperate bunch, probably because of the amount of coffee they drink per day. I can already imagine how many of them do not even wait for the dump to start before pressing CTRL+C to interrupt the process. They really are cowards. Well, since this is going to cost me some time, I am going to take the opportunity to go take a leak.
Much, much later indeed…
:
:
Percent written 97
Percent written 98
Percent written 99
Dump successfully written
0: kd>
OK, so far so good. Now let us repeat the process in a debug session using the firewire cable. The same machine with the same amount of memory and even the same command.
1: kd> .dump /f c:\Temp\FIREWIRE.DMP
Creating c:\Temp\FIREWIRE.DMP - Full kernel dump
Percent written 0
Percent written 5
Percent written 10
:
:
Percent written 90
Percent written 95
Dump successfully written
1: kd>
Yeah, all right, the count goes up by fives instead of by ones like it did with the serial cable, big deal. It is no wonder it takes longer over the serial port; they spend processing on everything. Now we can compare the creation and modification dates in each file’s attributes in order to determine how long it took to generate them.
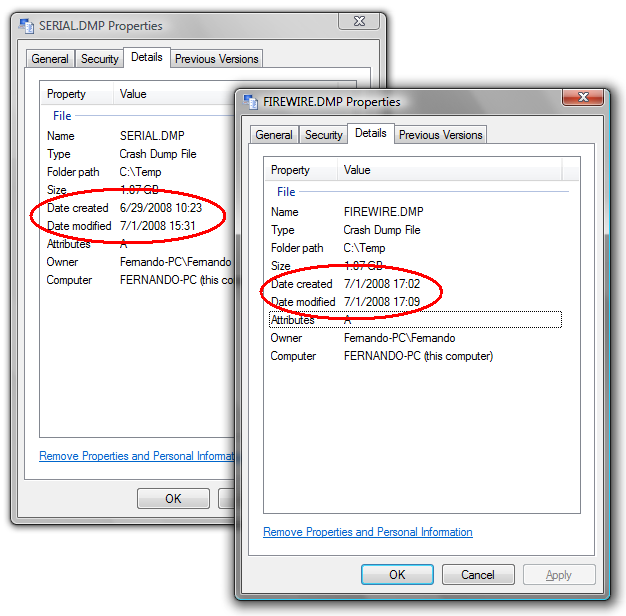
Bearing in mind that the month of June ends on the 30th, we can conclude that the dump over the serial port took approximately 2 days, 5 hours and 12 minutes. It is a shame this window does not show the seconds so we could be more precise here. In any case, also remembering that each minute has 60 seconds, the same dump generated over the firewire port took approximately 7 minutes. Wow, that was close! If it were not for that small advantage of 3187 minutes.
See you…
Leave a Reply