

After illustrating some of the Memory Manager‘s characteristics as a service provider to the Cache Manager in the previous post, today I will demonstrate that mere User-Mode applications can also use such services. By mapping files into memory the application gains a range of virtual addresses that contains the file’s content. Access to the file’s content is done simply by dereferencing a pointer, without the need to call the ReadFile() or WriteFile() functions.
Want a need for this? Imagine that your application needs to search for a certain string in a file, let’s say “DriverEntry”. In a “rice and beans” development, the file handle is obtained through the call to the CreateFile() function, and a buffer receives the partial content of the file, let’s suppose 200 bytes. A simple search function from the API could perform such a search in the buffer.
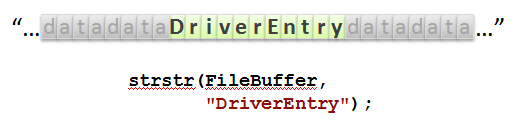
This solution would be perfect if there were no possibility of the searched word falling at the edges of the buffer, as illustrated below.
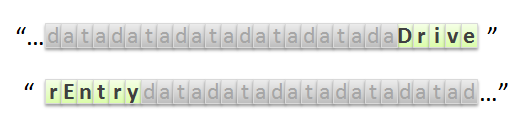
A smarter algorithm would have to be used to identify the prefix and continue the search on the next read of the file.
This is just a simple example, but it clearly illustrates one of the advantages of mapping files. If there were a simple function that received the path of a file and returned to us a pointer to its content, the search would be quite simple.
Files mapped into memory can also make writing to their content easier. By writing to the pointer received from such a mapping, the Memory Manager will take charge of doing the necessary I/O so that this new content reaches the disk.
A simple mapping function
Here I will exemplify the use of the routines that map a file into memory. The comments follow in the explanation.
/****
*** MapFileToMemory
**
** Routine that receives the path of a file that will be
** mapped into memory for reading. An address is
** returned to the calling routine as well as the size
** of the file.
*/
DWORD MapFileToMemory(LPCTSTR tzFileName,
LPVOID* ppMemory,
LPDWORD pdwSize)
{
HANDLE hFile = NULL,
hMapping = NULL;
DWORD dwError = ERROR_SUCCESS;
__try
{
__try
{
//-f--> Zeroes output variables.
*pdwSize = NULL;
*ppMemory = NULL;
//-f--> Here we open the file to be mapped
hFile = CreateFile(tzFileName,
GENERIC_READ,
FILE_SHARE_READ | FILE_SHARE_DELETE,
NULL,
OPEN_EXISTING,
FILE_ATTRIBUTE_NORMAL,
NULL);
//-f--> We check whether the file was opened; if not,
// the boogeyman comes and takes us away.
if (hFile == INVALID_HANDLE_VALUE)
RaiseException(GetLastError(),
0,
0,
NULL);
//-f--> Although the file size is not necessary
// in this function, let's take advantage of having the file's
// handle in hand to obtain this information for
// the calling routine, which will need it.
*pdwSize = GetFileSize(hFile,
NULL);
//-f--> Here we create a mapping of the file.
// In kernel it would be the equivalent of creating a
// section of the file.
hMapping = CreateFileMapping(hFile,
NULL,
PAGE_READONLY,
0,
0,
NULL);
//-f--> Preventing the boogeyman.
if (!hMapping)
RaiseException(GetLastError(),
0,
0,
NULL);
//-f--> Here the mapping is actually done and we get the
// range of addresses that will contain the content
// of the file.
*ppMemory = MapViewOfFile(hMapping,
FILE_MAP_READ,
0,
0,
0);
//-f--> The same boogeyman trick I already mentioned.
if (!*ppMemory)
RaiseException(GetLastError(),
0,
0,
NULL);
}
__finally
{
//-f--> Here is where we will do all the cleanup,
// closing the handles that were opened.
if (hFile)
CloseHandle(hFile);
if (hMapping)
CloseHandle(hMapping);
}
}
__except(EXCEPTION_EXECUTE_HANDLER)
{
//-f--> Oops! Something did not go as rehearsed.
// Find someone to blame and pretend it is not your problem.
dwError = GetExceptionCode();
}
return dwError;
}
This example is really quite simple, but feel free to add parameters that make this function more flexible and complex.
“Fernando, even if the file was mapped successfully, you close the file handle and the mapping handle. Shouldn’t that release the references this program has to the file?”
Actually, after we create the file mapping using the CreateFileMapping() routine, which receives the file handle, an extra reference has already been made to the file, and so we could already close its handle if we wanted to. The same happens with the call to the MapViewOfFile() routine, which receives the mapping handle, and which in turn has an indirect reference to the mapped file. In other words, once everything is mapped we can close all the handles and let the indirect references take care of it.
In the next source code we will see a simple example of using this function.
/****
*** _tmain
**
** Simple use of the file-mapping function.
** Just so nobody says I did not do every little bit...
*/
int _tmain(int argc, _TCHAR* argv[])
{
PBYTE pBuffer;
DWORD dwError, dwSize, i;
//-f--> Passes the file name and obtains the pointer
// with its content mapped. Just like that...
dwError = MapFileToMemory(_T("C:\\Temp\\Test.txt"),
(LPVOID*)&pBuffer,
&dwSize);
//-f--> Testing for errors never hurts.
if (dwError == ERROR_SUCCESS)
{
//-f--> Moments of suspense before touching the address.
printf("Hit any key to access the buffer at 0x%p...\n", pBuffer);
_getch();
//-f--> Prints each character stored in the file.
// "Look, Mom! No ReadFile()!"
for (i=0; i
printf("%c", pBuffer[i]);
//-f--> Here the mapping is undone.
UnmapViewOfFile(pBuffer);
}
return dwError;
}
At the end of this example we can observe the call to the UnmapViewOfFile() routine, which simply receives the base pointer of the file mapping. With this call, all internal references are undone and the file is finally closed.
Testing the toy
So that we can run a silly test, create a text file using Notepad.exe.
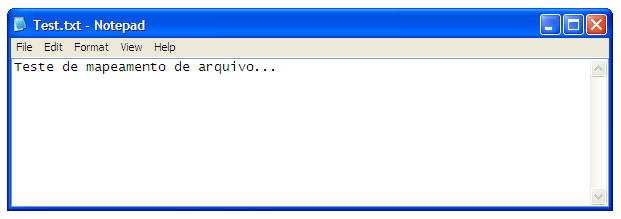
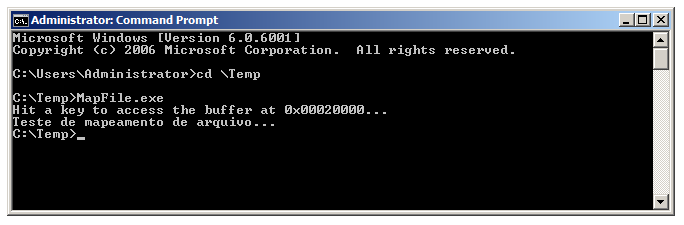
Running the test application we have the output as illustrated below.
Now in the replay slow motion
With WinDbg we can observe the exact moment when the application accesses the range of addresses referring to the file’s content. To do this we will place a breakpoint on the file-read routine of the Ntfs.sys driver; this way we will be able to see the Memory Manager’s request being served. For this to happen, the text file cannot be in the system cache, so if you have already run the test application at least once, you will have to restart the system.
If you have not used WinDbg yet and do not know how to connect it to the system, then read this post for a quick start. After connecting WinDbg to the system Kernel, go to the directory where the test application is and run it, but do not press any key yet, leaving it stopped as shown below:
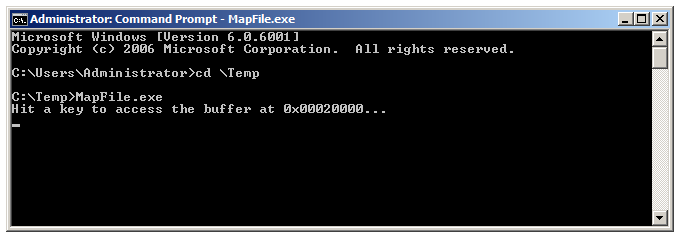
After that, press Ctrl+Break in WinDbg so that you gain control over the debugged system, which at this moment will remain frozen.
To place that breakpoint on the file-read routine of Ntfs.sys, we will need to know where this routine is within the driver. We can obtain this information using WinDbg’s !drvobj extension as shown below.
kd> !drvobj \FileSystem\Ntfs 2
Driver object (843fd650) is for:
\FileSystem\Ntfs
DriverEntry: 828f5b75 Ntfs!GsDriverEntry
DriverStartIo: 00000000
DriverUnload: 00000000
AddDevice: 00000000
Dispatch routines:
[00] IRP_MJ_CREATE 8289400a Ntfs!NtfsFsdCreate
[01] IRP_MJ_CREATE_NAMED_PIPE 8165a013 nt!IopInvalidDeviceRequest
[02] IRP_MJ_CLOSE 82896fcf Ntfs!NtfsFsdClose
[03] IRP_MJ_READ 82818514 Ntfs!NtfsFsdRead
[04] IRP_MJ_WRITE 82815638 Ntfs!NtfsFsdWrite
[05] IRP_MJ_QUERY_INFORMATION 82895a88 Ntfs!NtfsFsdDispatchWait
[06] IRP_MJ_SET_INFORMATION 8281e950 Ntfs!NtfsFsdSetInformation
[07] IRP_MJ_QUERY_EA 82895a88 Ntfs!NtfsFsdDispatchWait
[08] IRP_MJ_SET_EA 82895a88 Ntfs!NtfsFsdDispatchWait
[09] IRP_MJ_FLUSH_BUFFERS 82884349 Ntfs!NtfsFsdFlushBuffers
[0a] IRP_MJ_QUERY_VOLUME_INFORMATION 828b5fc6 Ntfs!NtfsFsdDispatch
[0b] IRP_MJ_SET_VOLUME_INFORMATION 828b5fc6 Ntfs!NtfsFsdDispatch
[0c] IRP_MJ_DIRECTORY_CONTROL 828b5d41 Ntfs!NtfsFsdDirectoryControl
[0d] IRP_MJ_FILE_SYSTEM_CONTROL 8289970e Ntfs!NtfsFsdFileSystemControl
[0e] IRP_MJ_DEVICE_CONTROL 82879466 Ntfs!NtfsFsdDeviceControl
[0f] IRP_MJ_INTERNAL_DEVICE_CONTROL 8165a013 nt!IopInvalidDeviceRequest
[10] IRP_MJ_SHUTDOWN 8282b36b Ntfs!NtfsFsdShutdown
[11] IRP_MJ_LOCK_CONTROL 82823b7a Ntfs!NtfsFsdLockControl
[12] IRP_MJ_CLEANUP 828a1d42 Ntfs!NtfsFsdCleanup
[13] IRP_MJ_CREATE_MAILSLOT 8165a013 nt!IopInvalidDeviceRequest
[14] IRP_MJ_QUERY_SECURITY 828b5fc6 Ntfs!NtfsFsdDispatch
[15] IRP_MJ_SET_SECURITY 828b5fc6 Ntfs!NtfsFsdDispatch
[16] IRP_MJ_POWER 8165a013 nt!IopInvalidDeviceRequest
[17] IRP_MJ_SYSTEM_CONTROL 8165a013 nt!IopInvalidDeviceRequest
[18] IRP_MJ_DEVICE_CHANGE 8165a013 nt!IopInvalidDeviceRequest
[19] IRP_MJ_QUERY_QUOTA 82895a88 Ntfs!NtfsFsdDispatchWait
[1a] IRP_MJ_SET_QUOTA 82895a88 Ntfs!NtfsFsdDispatchWait
[1b] IRP_MJ_PNP 8286137b Ntfs!NtfsFsdPnp
Fast I/O routines:
FastIoCheckIfPossible 8288187b Ntfs!NtfsFastIoCheckIfPossible
FastIoRead 82880c38 Ntfs!NtfsCopyReadA
FastIoWrite 82881f53 Ntfs!NtfsCopyWriteA
FastIoQueryBasicInfo 82888c3a Ntfs!NtfsFastQueryBasicInfo
FastIoQueryStandardInfo 82888aa6 Ntfs!NtfsFastQueryStdInfo
FastIoLock 8287bf41 Ntfs!NtfsFastLock
FastIoUnlockSingle 8287bd75 Ntfs!NtfsFastUnlockSingle
FastIoUnlockAll 828cd7b3 Ntfs!NtfsFastUnlockAll
FastIoUnlockAllByKey 828cd958 Ntfs!NtfsFastUnlockAllByKey
ReleaseFileForNtCreateSection 8281e904 Ntfs!NtfsReleaseForCreateSection
FastIoQueryNetworkOpenInfo 8287ad84 Ntfs!NtfsFastQueryNetworkOpenInfo
AcquireForModWrite 8280c892 Ntfs!NtfsAcquireFileForModWrite
MdlRead 828cd0d8 Ntfs!NtfsMdlReadA
MdlReadComplete 81650af6 nt!FsRtlMdlReadCompleteDev
PrepareMdlWrite 828cd31f Ntfs!NtfsPrepareMdlWriteA
MdlWriteComplete 817f5a9a nt!FsRtlMdlWriteCompleteDev
FastIoQueryOpen 82874d03 Ntfs!NtfsNetworkOpenCreate
AcquireForCcFlush 8281ab35 Ntfs!NtfsAcquireFileForCcFlush
ReleaseForCcFlush 8281aa9c Ntfs!NtfsReleaseFileForCcFlush
As you must be imagining, the Ntfs read routine is used very frequently, which would make this breakpoint stop many times without the slightest relation to our test. To limit the breakpoint’s scope, we will make it apply only to the thread that will make the request we are waiting for.
As I already explained in the previous post, when the memory address is obtained, the file has not yet been read. When the application dereferences this pointer looking for the data, a page fault will be generated and the Memory Manager will take control over the thread by means of a system trap. This is the thread that will be used to perform the read of the file that will supply the memory page at the Memory Manager’s request. This is the reason why our test program waits for a key to be pressed before accessing the buffer. This gives us the opportunity to obtain the identification of the thread that is waiting for that event.
We use the !process extension to locate our test program, and it will also list its threads, which in our case is a single one.
kd> !process 0 2 MapFile.exe
PROCESS 84bf6d90 SessionId: 1 Cid: 0b60 Peb: 7ffdf000 ParentCid: 0b40
DirBase: 1f09b4c0 ObjectTable: 8e77ccd0 HandleCount: 5.
Image: MapFile.exe
THREAD 84f6cb50 Cid 0b60.0b64 Teb: 7ffde000 Win32Thread: 00000000 WAIT: (WrLpcReply) ...
84f6cd64 Semaphore Limit 0x1
kd> bp /1 /t 84f6cb50 Ntfs!NtfsFsdRead
kd> g
After placing the breakpoint, we can release the execution of the system and type something in the test application. This will make our breakpoint interrupt the system just as we intended. Looking at the call stack we have at the moment, we can evidence the execution of the trap that was generated by the test application. This trap is being served by the Memory Manager.
Breakpoint 0 hit
Ntfs!NtfsFsdRead:
82818514 6a40
kd> kb
ChildEBP RetAddr Args to Child
8f395b6c 816f00c3 84438020 84f40290 84f40290 Ntfs!NtfsFsdRead
8f395b84 821a3ba7 84437730 84f40290 00000000 nt!IofCallDriver+0x63
8f395ba8 821a3d64 8f395bc8 84437730 00000000 fltmgr!FltpLegacyProcessingAfterPreCallbacksCompleted+0x251
8f395be0 816f00c3 84437730 84f40290 00000000 fltmgr!FltpDispatch+0xc2
8f395bf8 8167bf2e 84f6cb50 8443a18c 8443a158 nt!IofCallDriver+0x63
8f395c14 816b8d51 00000043 84f6cb50 8443a198 nt!IoPageRead+0x172
8f395cd0 816db03f 00020000 90825810 00000000 nt!MiDispatchFault+0xd18
8f395d4c 8168ebf4 00000000 00020000 00000001 nt!MmAccessFault+0x1fb7
8f395d4c 0018d972 00000000 00020000 00000001 nt!KiTrap0E+0xdc
0015fbc0 0018ec36 00000001 00281a28 00281a78 MapFile!wmain+0x72
0015fc0c 0018eb0f 0015fc20 77554911 7ffdf000 MapFile!__tmainCRTStartup+0x116
0015fc14 77554911 7ffdf000 0015fc60 77ace4b6 MapFile!wmainCRTStartup+0xf
0015fc20 77ace4b6 7ffdf000 77a26775 00000000 kernel32!BaseThreadInitThunk+0xe
0015fc60 77ace489 0018b532 7ffdf000 00000000 ntdll!__RtlUserThreadStart+0x23
0015fc78 00000000 0018b532 7ffdf000 00000000 ntdll!_RtlUserThreadStart+0x1b
As we know the prototype that a dispatch routine must have, we know that the second parameter of the NtfsFsdRead() routine is the address of the IRP that the driver received. Using the !irp extension we can obtain details about the IRP. This allows us to know the FileObject to which this request is destined.
kd> !irp 84f40290
Irp is active with 8 stacks 8 is current (= 0x84f403fc)
Mdl=8443a1d8: No System Buffer: Thread 84f6cb50: Irp stack trace.
cmd flg cl Device File Completion-Context
[ 0, 0] 0 0 00000000 00000000 00000000-00000000
Args: 00000000 00000000 00000000 00000000
[ 0, 0] 0 0 00000000 00000000 00000000-00000000
Args: 00000000 00000000 00000000 00000000
[ 0, 0] 0 0 00000000 00000000 00000000-00000000
Args: 00000000 00000000 00000000 00000000
[ 0, 0] 0 0 00000000 00000000 00000000-00000000
Args: 00000000 00000000 00000000 00000000
[ 0, 0] 0 0 00000000 00000000 00000000-00000000
Args: 00000000 00000000 00000000 00000000
[ 0, 0] 0 0 00000000 00000000 00000000-00000000
Args: 00000000 00000000 00000000 00000000
[ 0, 0] 0 0 00000000 00000000 00000000-00000000
Args: 00000000 00000000 00000000 00000000
>[ 3, 0] 0 0 84438020 84bd0028 00000000-00000000
\FileSystem\Ntfs
Args: 00001000 00000000 00000000 00000000
With the FileObject address in hand, the !fileobj extension will show us more details about this object. Thus we can verify that the file to be read is indeed our text file that was mapped.
kd> !fileobj 84bd0028
\Temp\Test.txt
Device Object: 0x84439030 \Driver\volmgr
Vpb: 0x84436e28
Access: Read SharedRead SharedDelete
Flags: 0x44042
Synchronous IO
Cache Supported
Cleanup Complete
Handle Created
FsContext: 0x92a4cd80 FsContext2: 0x92a4ced8
CurrentByteOffset: 0
Cache Data:
Section Object Pointers: 84d24e74
Shared Cache Map: 00000000
Knowing that we are in the context of the thread that made the access, we can take a little peek at the accessed address before the page fault is served. This address was shown in the test application’s output before the breakpoint interrupted the execution of the system.
kd> db 0x00020000
00020000 ?? ?? ?? ?? ?? ?? ?? ??-?? ?? ?? ?? ?? ?? ?? ?? ????????????????
00020010 ?? ?? ?? ?? ?? ?? ?? ??-?? ?? ?? ?? ?? ?? ?? ?? ????????????????
00020020 ?? ?? ?? ?? ?? ?? ?? ??-?? ?? ?? ?? ?? ?? ?? ?? ????????????????
00020030 ?? ?? ?? ?? ?? ?? ?? ??-?? ?? ?? ?? ?? ?? ?? ?? ????????????????
00020040 ?? ?? ?? ?? ?? ?? ?? ??-?? ?? ?? ?? ?? ?? ?? ?? ????????????????
00020050 ?? ?? ?? ?? ?? ?? ?? ??-?? ?? ?? ?? ?? ?? ?? ?? ????????????????
00020060 ?? ?? ?? ?? ?? ?? ?? ??-?? ?? ?? ?? ?? ?? ?? ?? ????????????????
00020070 ?? ?? ?? ?? ?? ?? ?? ??-?? ?? ?? ?? ?? ?? ?? ?? ????????????????
“Fernando, why do question marks appear? It’s fine that the file’s content has not yet been copied to the application’s buffer, but shouldn’t we see garbage or even zeros?”
Look, that question of yours was really very good; I don’t think I myself could have thought of a better question. Actually the answer to this question is linked to that crude answer from the previous post. What happens is that a range of addresses was reserved to contain the memory pages with the file’s content. Since no access has been made yet, this virtual address does not yet point to any physical memory page. Without this physical page one cannot determine its data. We can verify this using WinDbg’s !vtop extension, which translates virtual addresses to physical addresses.
kd> !vtop 0 0x00020000
X86VtoP: Virt 00020000, pagedir 1f09b4c0
X86VtoP: PAE PDPE 1f09b4c0 - 000000001876d801
X86VtoP: PAE PDE 1876d000 - 0000000018908867
X86VtoP: PAE PTE 18908100 - ffffffff00000420
X86VtoP: Virt ffffffff, pagedir 1f09b4c0
X86VtoP: PAE PDPE 1f09b4d8 - 00000000187b0801
X86VtoP: PAE PDE 187b0ff8 - 0000000000128063
X86VtoP: PAE PTE 128ff8 - 0000000000000000
X86VtoP: PAE zero PTE
Virtual address 20000 translation fails, error 0x8007001E.
kd> !error 0x8007001E
Error code: (HRESULT) 0x8007001e (2147942430) - The system cannot read from the specified device.
The attempt to translate this virtual address results in an error. Let’s try to do this translation again after the page fault is served. Let’s release the execution of the system up to the return address for the MmAccessFault() routine. This address was obtained in the thread’s call stack and was highlighted in the results of the kd command already illustrated above.
kd> ga 8168ebf4
nt!KiTrap0E+0xdc:
8168ebf4 85c0 test eax,eax
kd> !vtop 0 0x00020000
X86VtoP: Virt 00020000, pagedir 1f09b4c0
X86VtoP: PAE PDPE 1f09b4c0 - 000000001876d801
X86VtoP: PAE PDE 1876d000 - 0000000018908867
X86VtoP: PAE PTE 18908100 - 8000000018844025
X86VtoP: PAE Mapped phys 18844000
Virtual address 20000 translates to physical address 18844000.
Here the page fault has already been served and control will be returned to the application. At this point the Memory Manager performed the necessary tasks so that this virtual address could now be translated to a physical page. Repeating the same translation attempt that failed earlier, we will have the following output.
kd> db 0x00020000
00020000 54 65 73 74 65 20 64 65-20 6d 61 70 65 61 6d 65 Teste de mapeame
00020010 6e 74 6f 20 64 65 20 61-72 71 75 69 76 6f 2e 2e nto de arquivo..
00020020 2e 00 00 00 00 00 00 00-00 00 00 00 00 00 00 00 ................
00020030 00 00 00 00 00 00 00 00-00 00 00 00 00 00 00 00 ................
00020040 00 00 00 00 00 00 00 00-00 00 00 00 00 00 00 00 ................
00020050 00 00 00 00 00 00 00 00-00 00 00 00 00 00 00 00 ................
00020060 00 00 00 00 00 00 00 00-00 00 00 00 00 00 00 00 ................
00020070 00 00 00 00 00 00 00 00-00 00 00 00 00 00 00 00 ................
Releasing the execution of the system, the application will make the access to the buffer and we will have the same output shown earlier. It is worth remembering that to repeat this experiment, it is necessary to restart the system, because the text file’s content is now in the system cache. This means that the page fault will not occur again until this page is discarded by the Cache Manager. Such an event depends on many factors and may not happen until the machine shuts down.
Anyway, this post, besides bringing a simple file-mapping function, also brings the same technical blah-blah-blah as always. I hope you liked it.
See you! 😉
Leave a Reply